Client: Tech Crowd
Scope: Tech Crowd reached out for a tabloid-sized, static infographic for their "Technology and Culture" report.
Tools: Adobe Illustrator
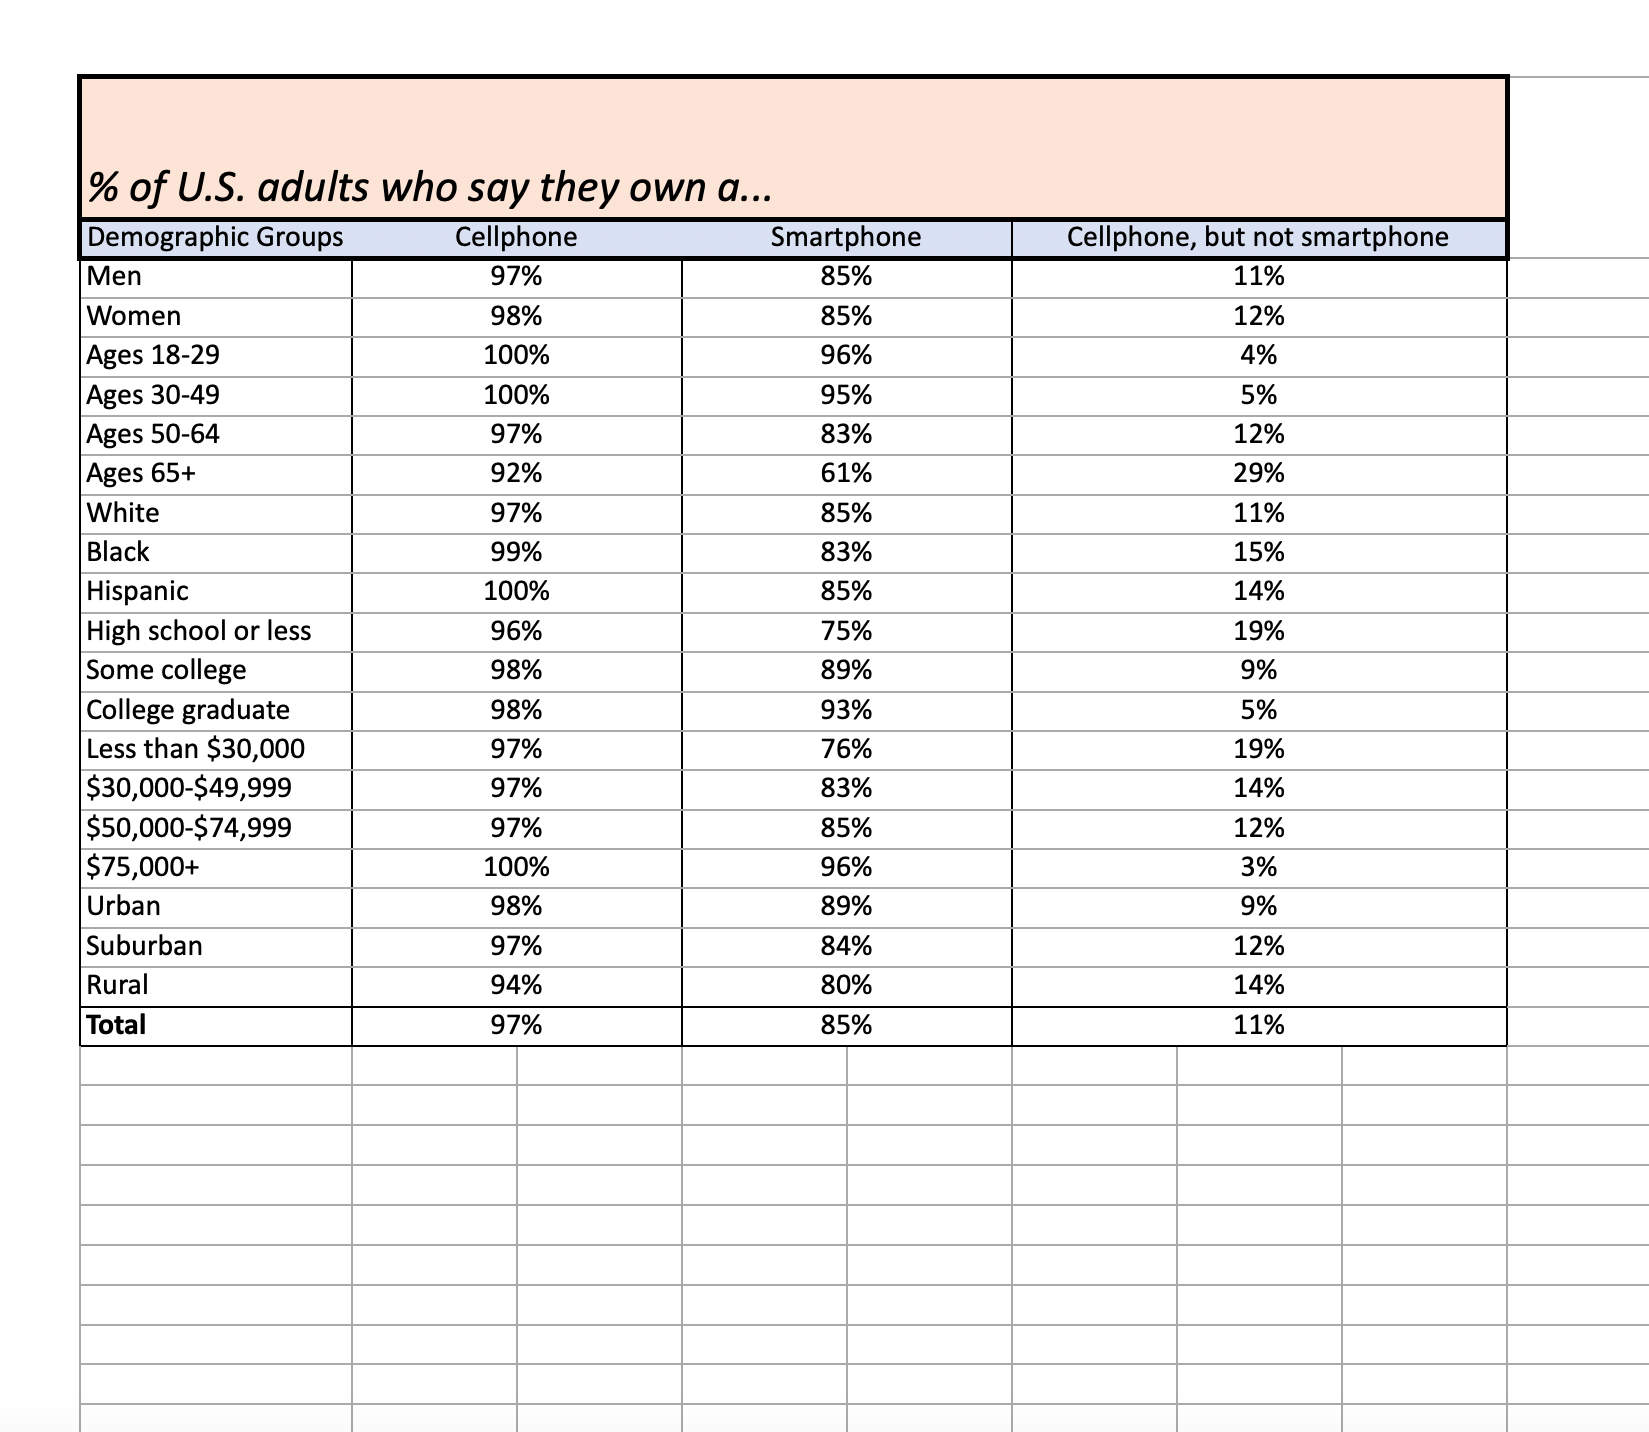
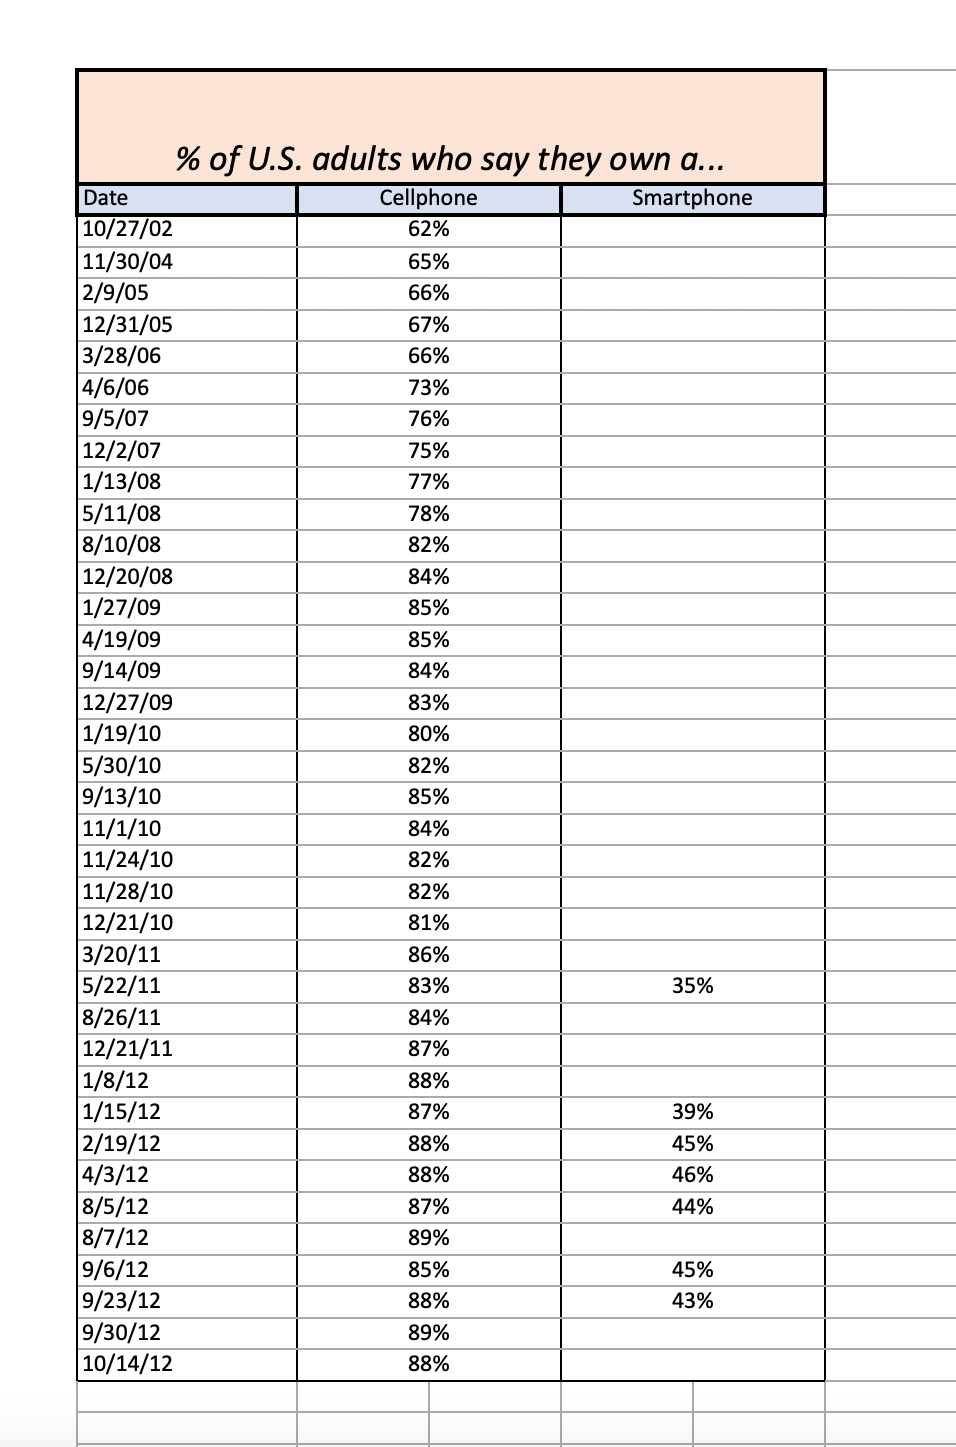
Provided a given data set and a brand style guide, I generated a data visualization that narrates the data story visually and also incorporates design elements to ensure seamless brand visibility and recognition.

Data A

Data B
A dynamic infographic not only met Tech Crowd's specifications but also exemplified my proficiency in transforming raw data into engaging and impactful visual narratives to simplify and articulate compelling data stories.
